1 Habitat Monitor Software User and Maintenance Manual
| Author: | Ambar Mehrotra |
|---|
1.1 Introduction
1.1.1 Purpose
This document describes the installation, use and maintenance of the Health Monitor.
1.1.2 Applicable Documents
- [1] – Software Engineering Practices Guidelines for the ERAS Project
- [2] – Software Architecture Document for the Habitat Monitor
- [3] – TANGO distributed control system
- [4] – PyTANGO - Python bindings for TANGO
- [5] – Tango Setup
- [6] – Qt Installation
- [7] – PyQt Installation
- [8] – Adding a new Server in Tango
1.1.3 Glossary
API- Application Programming Interface
AS- Aouda Device Server
ERAS- European Mars Analog Station
GUI- Graphic User Interface
HM- Habitat Monitor Device Server
IMS- Italian Mars Society
TBC- To Be Confirmed
TBD- To Be Defined
1.2 Installation Guide
The first step is to download the component to install (Health Monitor Daemon, Aouda Daemon or Health Monitor GUI) in the machine that is going to run it. The components can be installed all in the same computer, all in different computers or any combination thereof.
1.2.1 Installing the Central Tango Daemon on the Central Tango Server
You can install this component following the Tango Setup guide. Tango’s libraries must be installed in all computers.
1.2.2 Installing the Health Monitor Daemon
1.2.2.1 Prerequisites
Python 2.7
- Python modules:
- python-qt4
- numpy >= 1.8.1
- pandas >= 0.14.0
- pip >= 1.5.4
- pyqtgraph
- PyTango >= 8.1.5
- pymongo >= 3.0.3
libboost-python-dev >= 1.54
MongoDB
1.2.2.1.1 Python 2.7, numpy, pip and scipy
Python 2.7 comes pre-installed, but just in case you can install it, together with numpy, pip and scipy, with:
sudo apt-get install -y libboost-python-dev python2.7 python-pip python-numpy python-scipy
1.2.2.1.2 PyTango
sudo pip install PyTango –egg
1.2.2.1.3 MongoDB
1. Import the public key used by the package management system. The Ubuntu package management tools (i.e. dpkg and apt) ensure package consistency and authenticity by requiring that distributors sign packages with GPG keys. Issue the following command to import the MongoDB public GPG Key:
sudo apt-key adv --keyserver hkp://keyserver.ubuntu.com:80 --recv 7F0CEB102. Create a list file for MongoDB. Create the /etc/apt/sources.list.d/mongodb-org-3.0.list list file using the following command:
echo "deb http://repo.mongodb.org/apt/ubuntu "$(lsb_release -sc)"/mongodb-org/3.0 multiverse" | sudo tee /etc/apt/sources.list.d/mongodb-org-3.0.list3. Reload local package database.
sudo apt-get update4. Install the latest stable version of MongoDB.
   sudo apt-get install -y mongodb-org

Directly from binaries:
~~~~~~~~~~~~~~~~~~~~~~~
Follow the following tutorial - http://docs.mongodb.org/manual/tutorial/install-mongodb-on-linux/
1.2.2.1.4 pymongo
sudo pip install pymongo
1.2.2.1.5 pyqtgraph:
- Download the appropriate installer for your Operating System and install from the following link:
- http://www.pyqtgraph.org/
1.3 Walkthrough
1.3.1 Start the GUI
1. Navigate to the mongodb directory and start the mongodb daemon
sudo ./mongodYou can also start it by issuing the following command if you have exported it to system path
sudo mongod2. Start the servers that you want to monitor through the GUI. For example:
sudo aouda 1 simulate_dataIf you want to add an aouda server to the GUI to monitor.
3. Navigate to the Habitat Monitor directory and start the application by issuing the following command:
python app.py
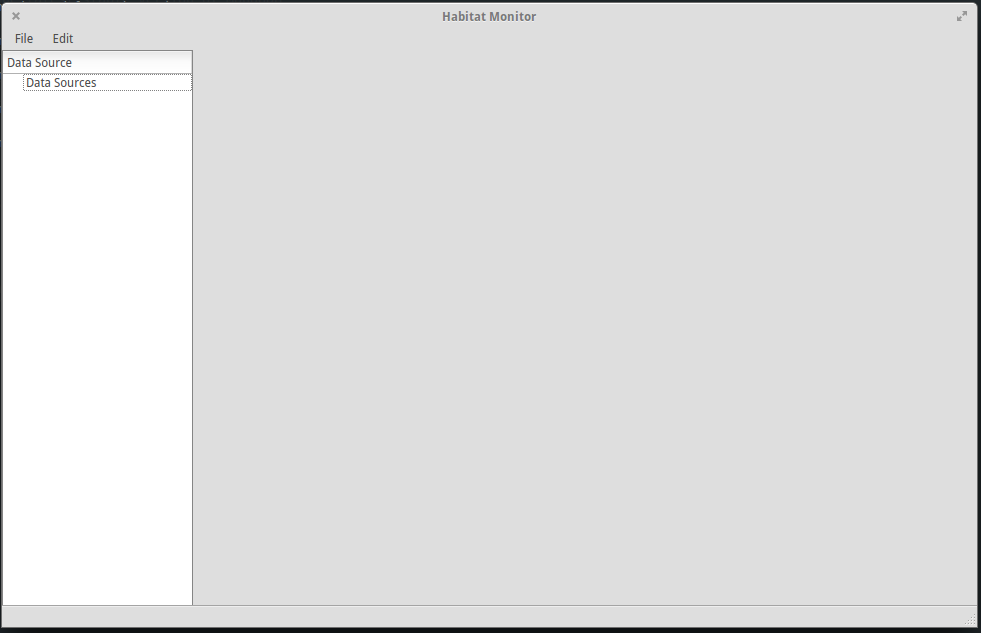
- Once the GUI has successfully started you will be shown a screen similar to the following image:
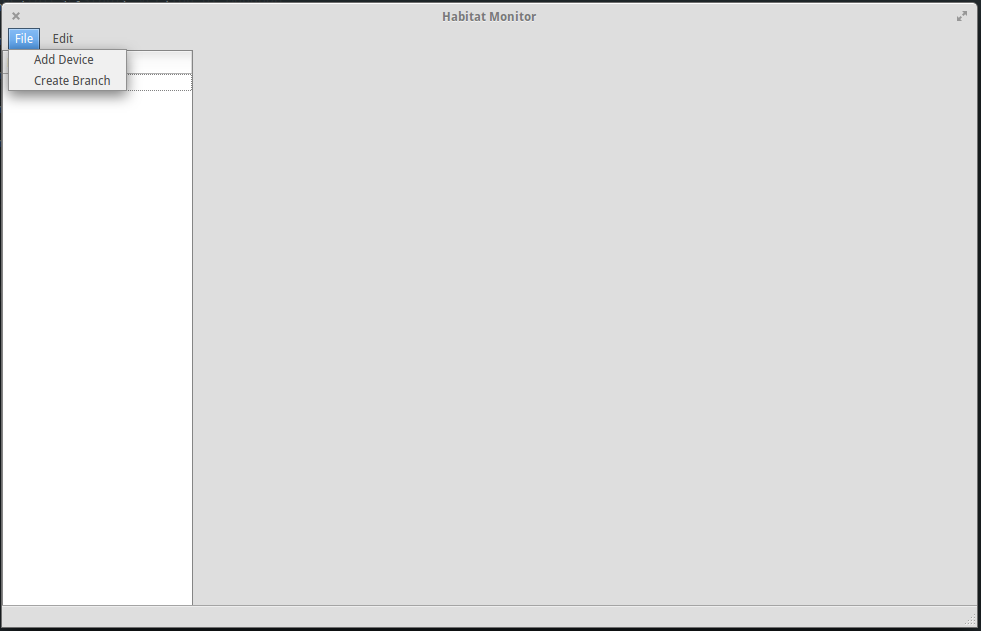
1.3.2 Adding Devices
Click on ‘File’ menu.
- Click on ‘Add Device’ option.
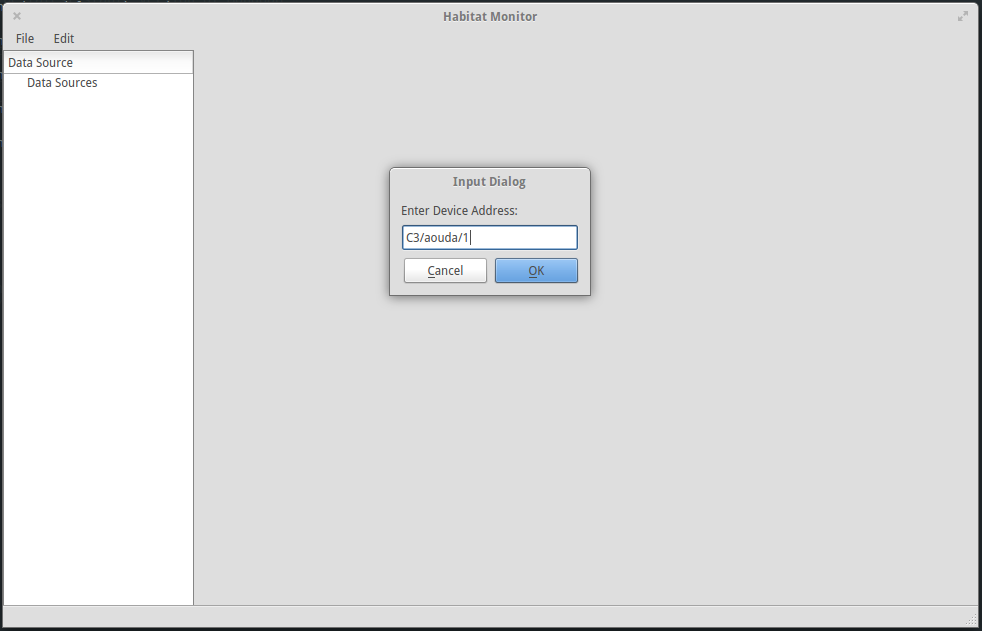
- Enter the device address.
- Select and attribute from the device and a summary function. Also enter the summary period.
- The summary period should be in the format ‘hh:mm:ss.ms’.
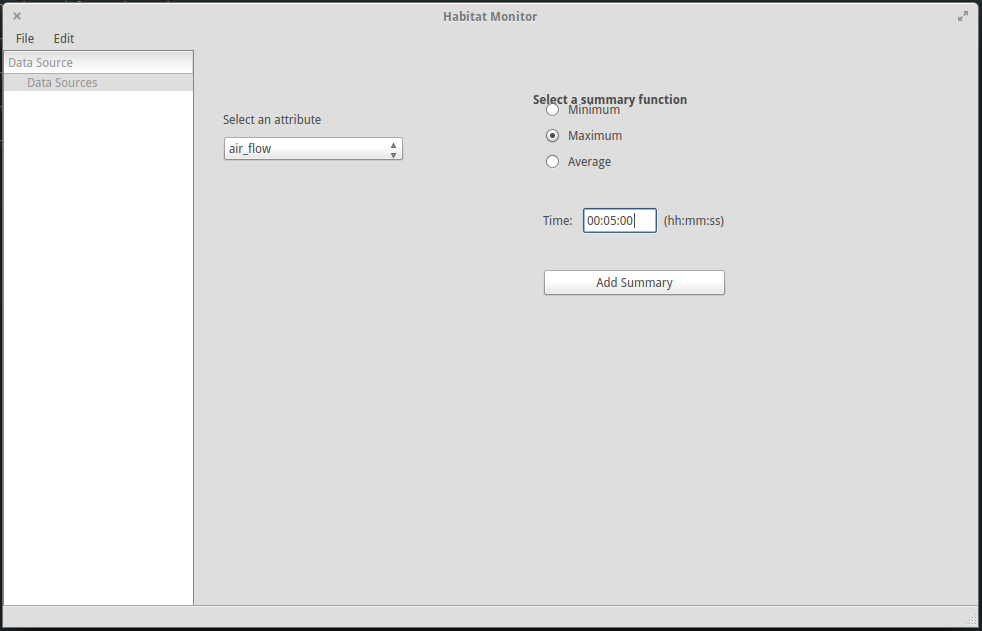
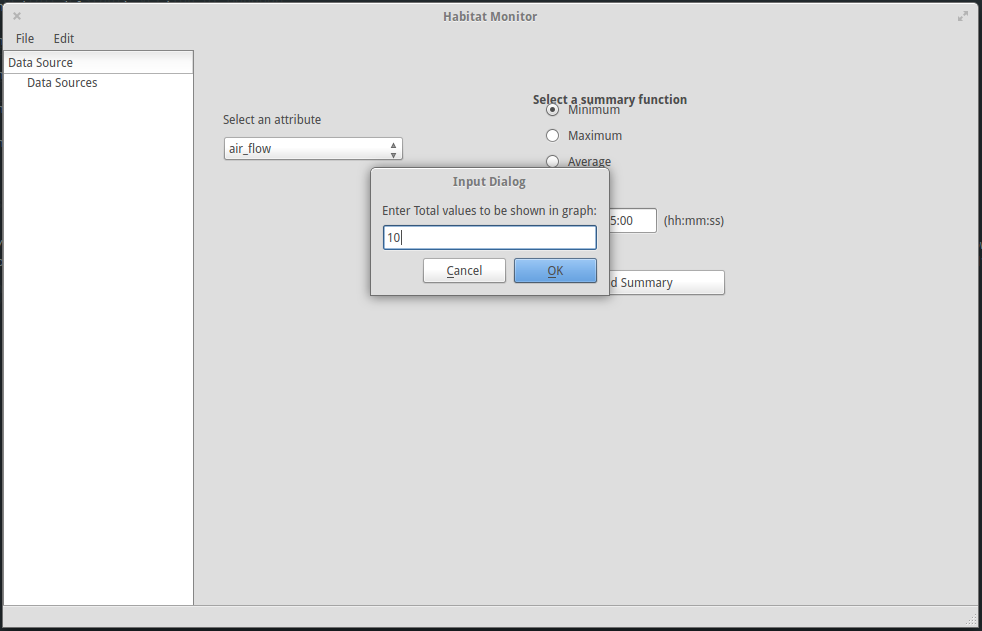
Click on ‘Add Summary’ button.
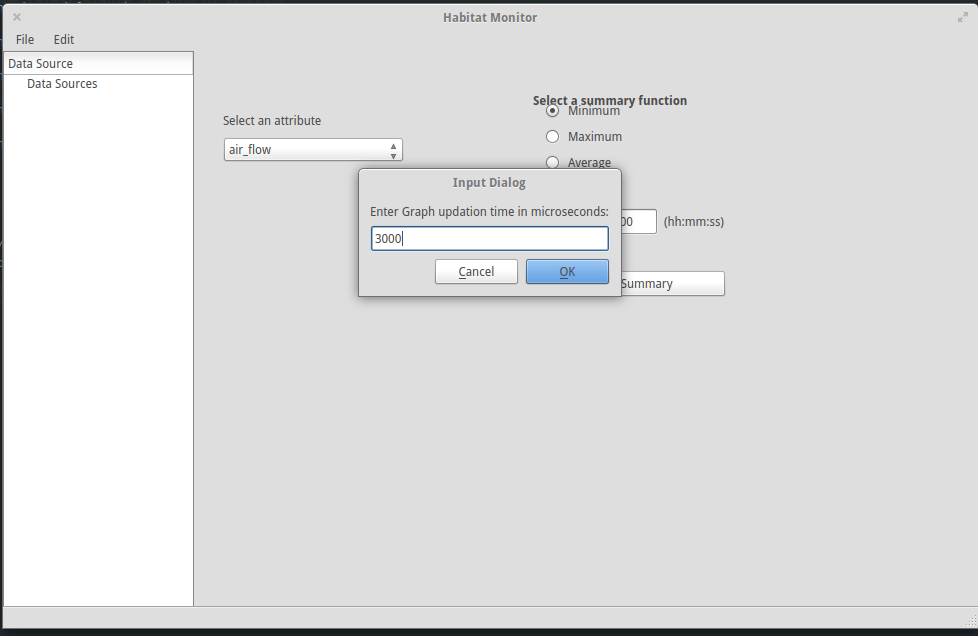
- Enter the ‘Total values to be shown in the graph’.
- Enter the graph updation time in microseconds.
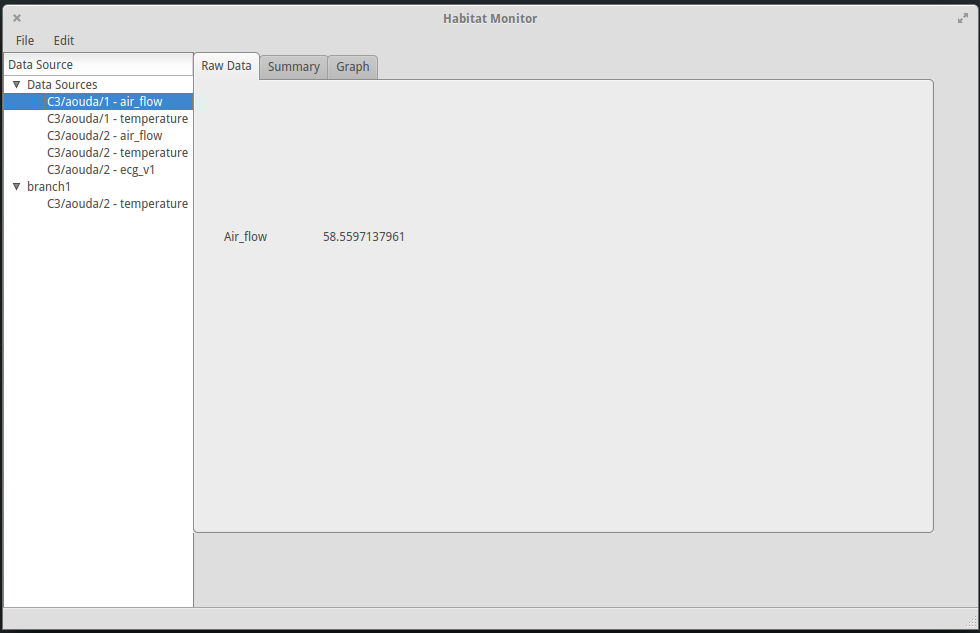
- Raw Data Tab - It shows the data coming in directly from the device server in case of leaves, i.e., device servers.
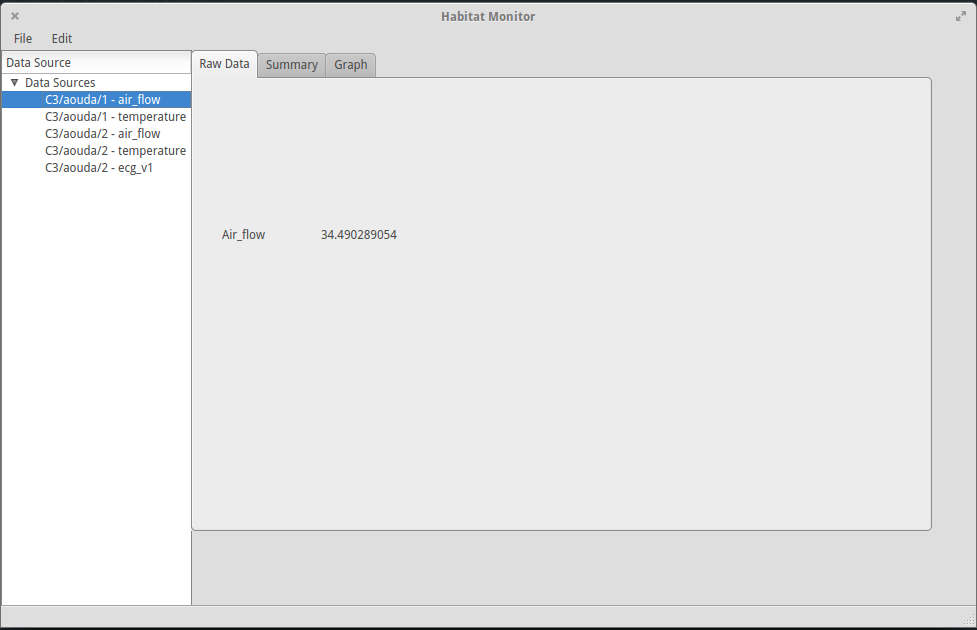
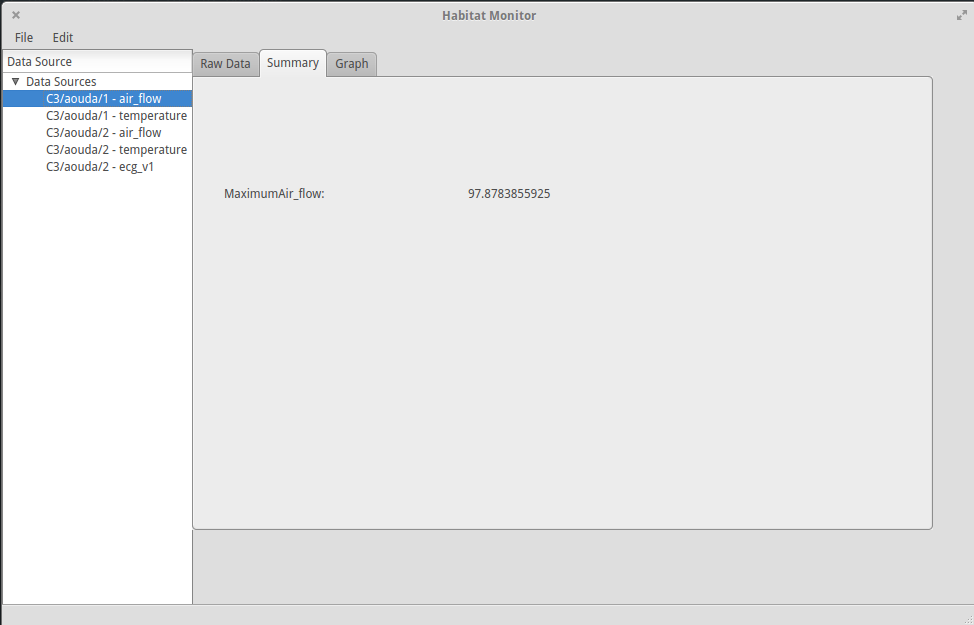
- Summary Tab - It shows the summary as calculated by the summary function in the provided time period
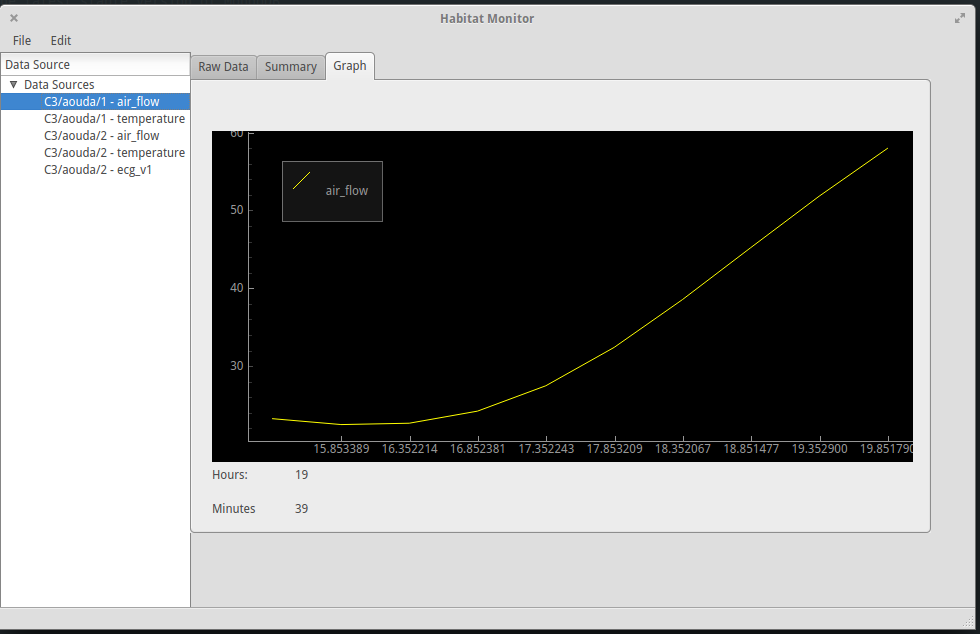
Graph Tab - It shows the real-time graph of the raw data according to the total number of values mentioned while adding a device and the graph updation frequency. User can edit these values via the ‘graph_config’ file inside the application directory. The hours and minutes are shown below of the graph panel while seconds and milliseconds are shown inside the graph panel in order to avoid large x-values and avoid cluttering.
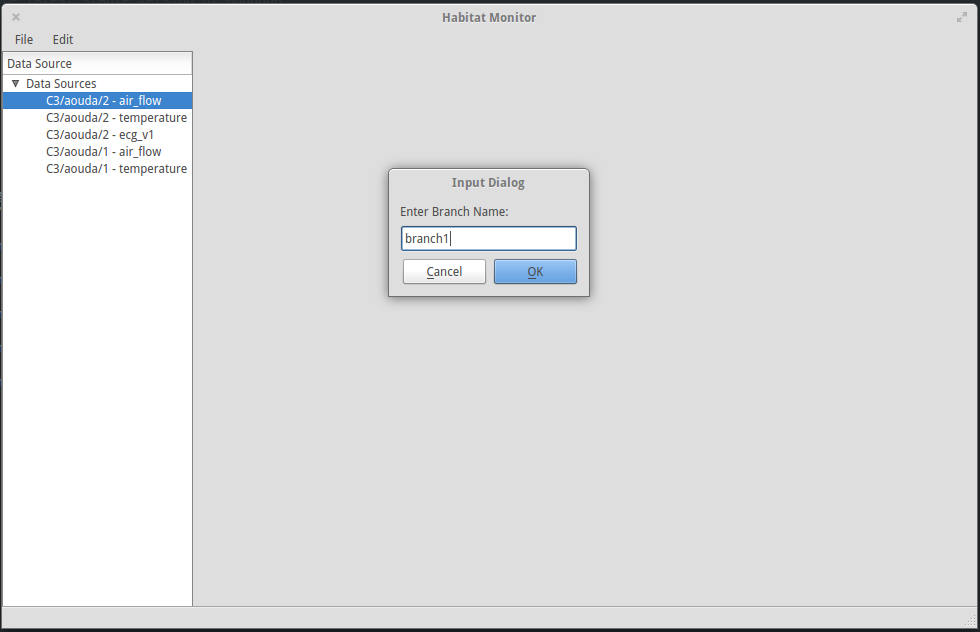
1.3.3 Creating Branches
Click on ‘File’ menu.
Click on ‘Create Branch’ option.
- Enter the branch name and click ok button.
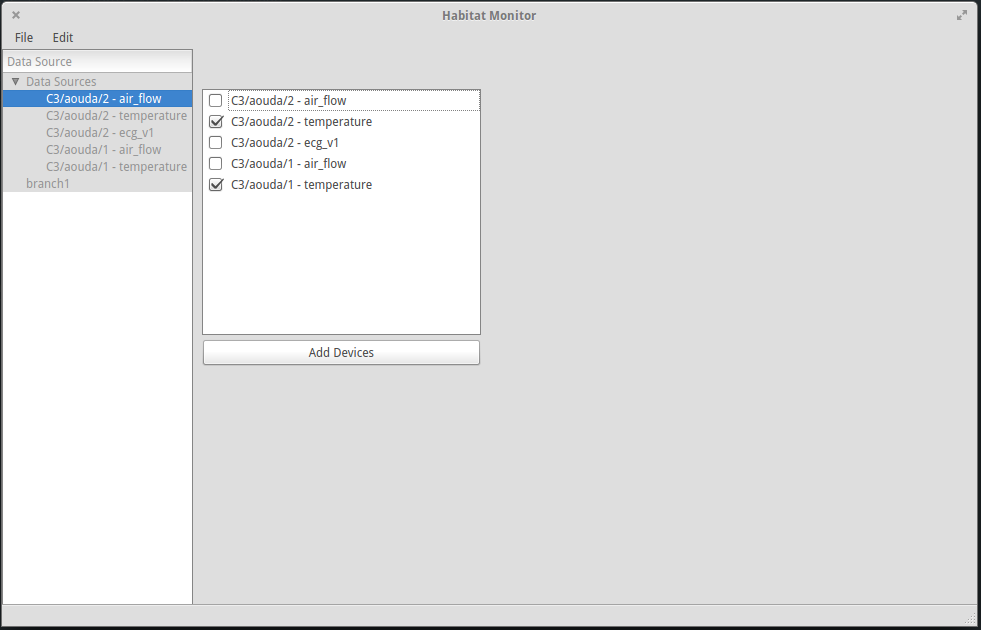
- Select the devices you want to add to the branch.
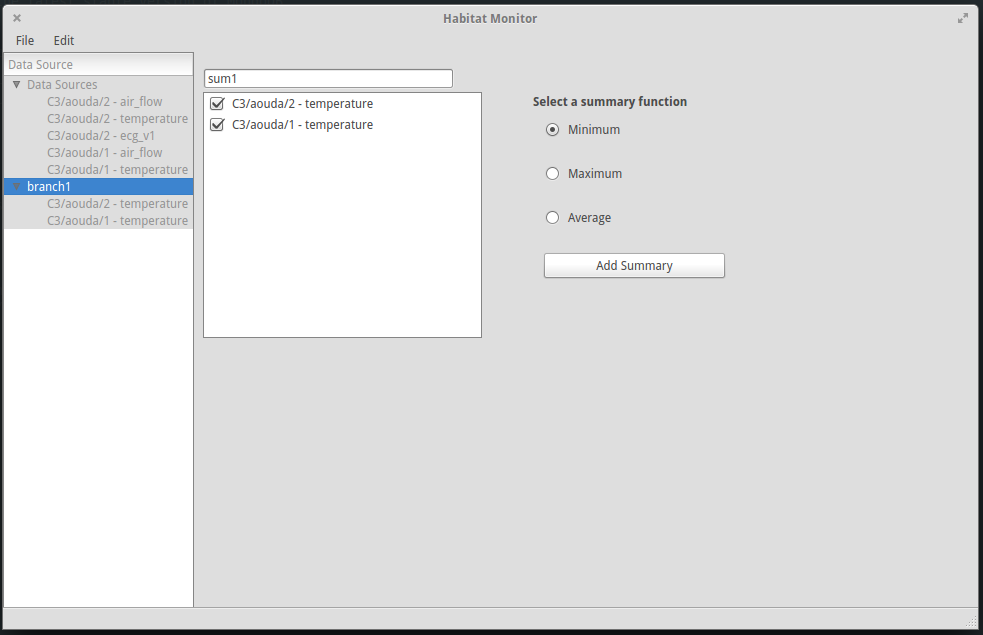
- Summary Creation - Enter summary name and select a summary function.
Unlike the leaf summary, there in no option to provide the summary time in case of branches as branch summary is calculated instantaneously.
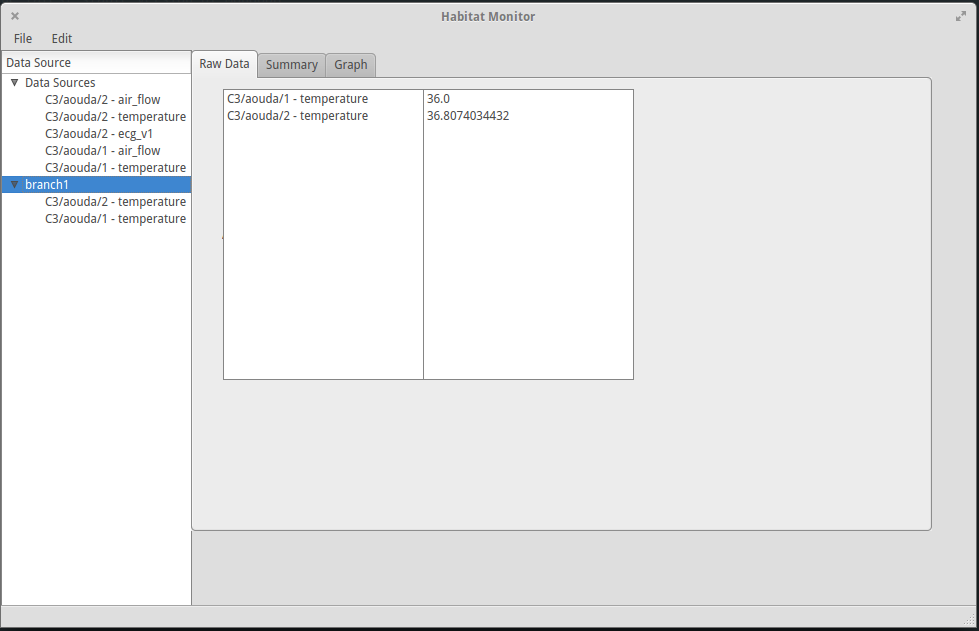
- Raw Data Tab - Shows the raw data for each child of the branch.
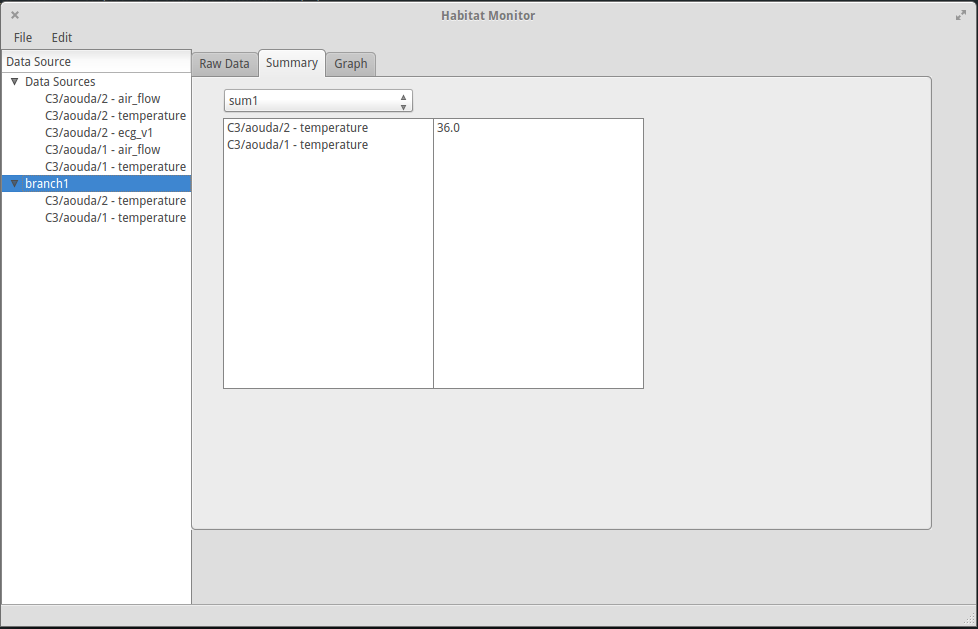
- Summary Tab - Shows the summary as defined by the summary function and summary name in the drop down box.
- Graph Tab - Shows the graph of the raw data. I avoided showing all graphs in the same pannel so as to avoid cluttering.
You can select the child from the dropdown menu and view its graph. .. image:: images/tutorial/15.PNG
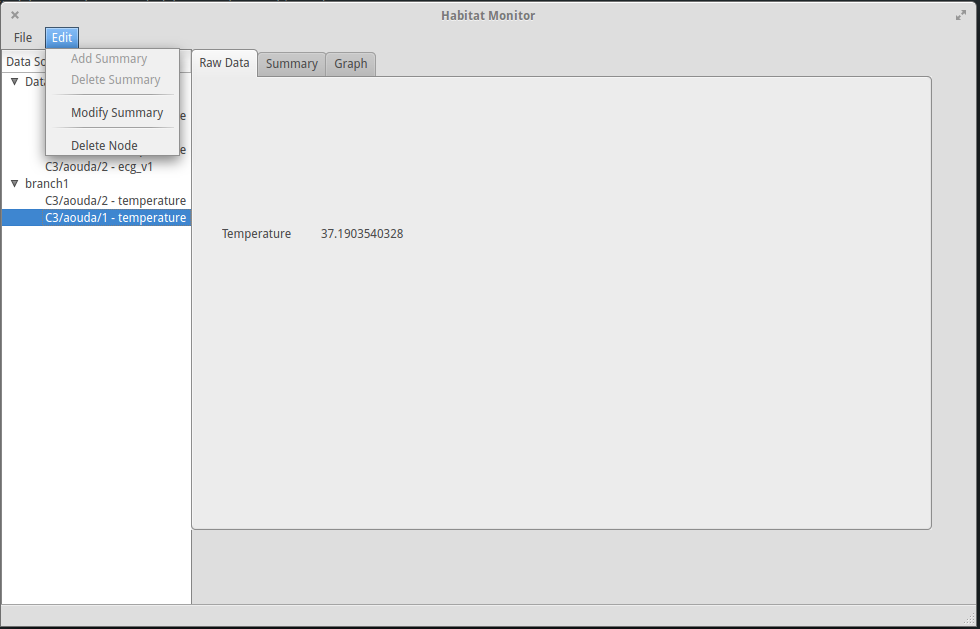
1.3.4 Modifications
1.3.4.1 Summary Modification
Summary modification is only for leaves, i.e., the data sources
- Click on the ‘Edit’ menu.
Click on the ‘Modify Summary’ option.
- Select the summary function and enter the summary time.
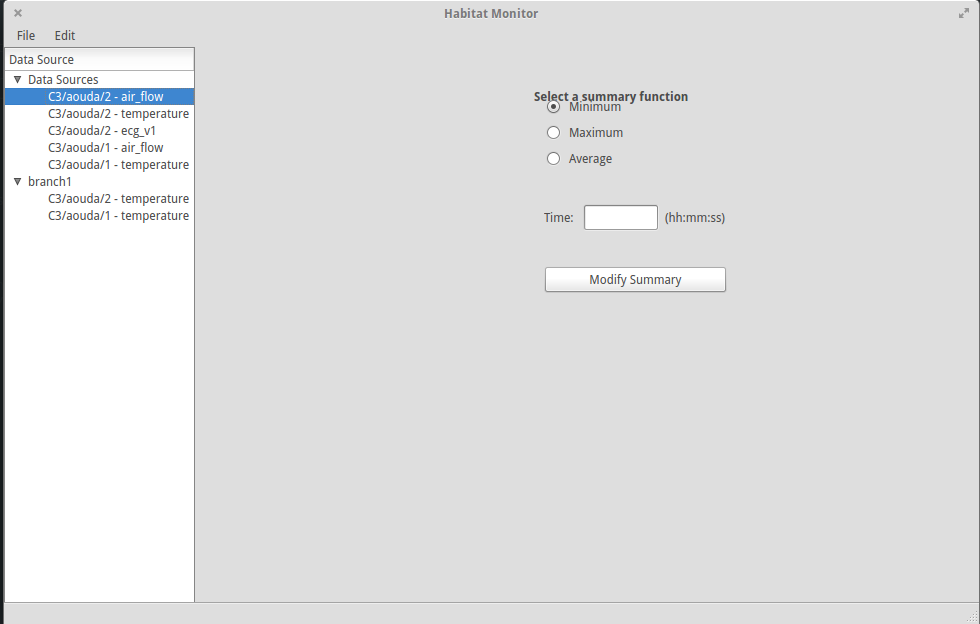
Click on ‘Modify Summary’ button.
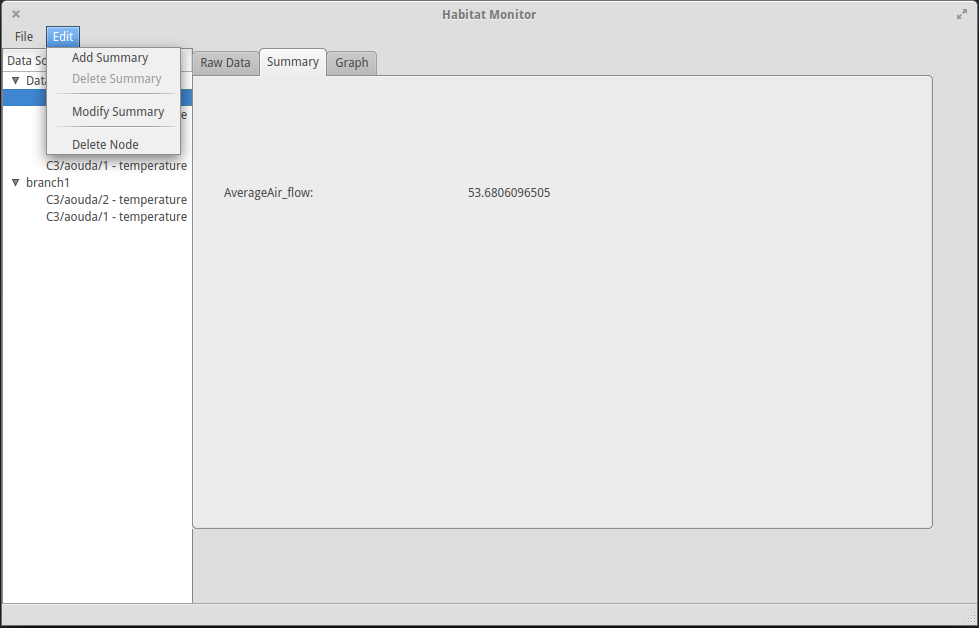
1.3.4.2 Summary Addition
Summary addition works only for branches.
Click on the ‘Edit’ menu.
- Click on the ‘Add Summary’ option.
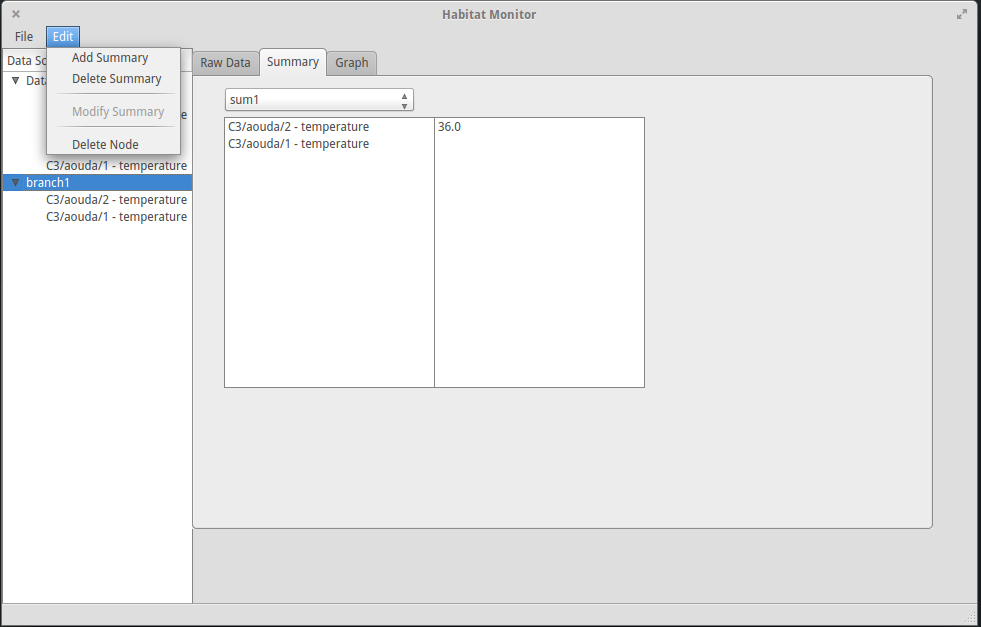
Enter the summary name, select the nodes you want to be added to the summary
- from amongst the branch children, select the summary summary function.
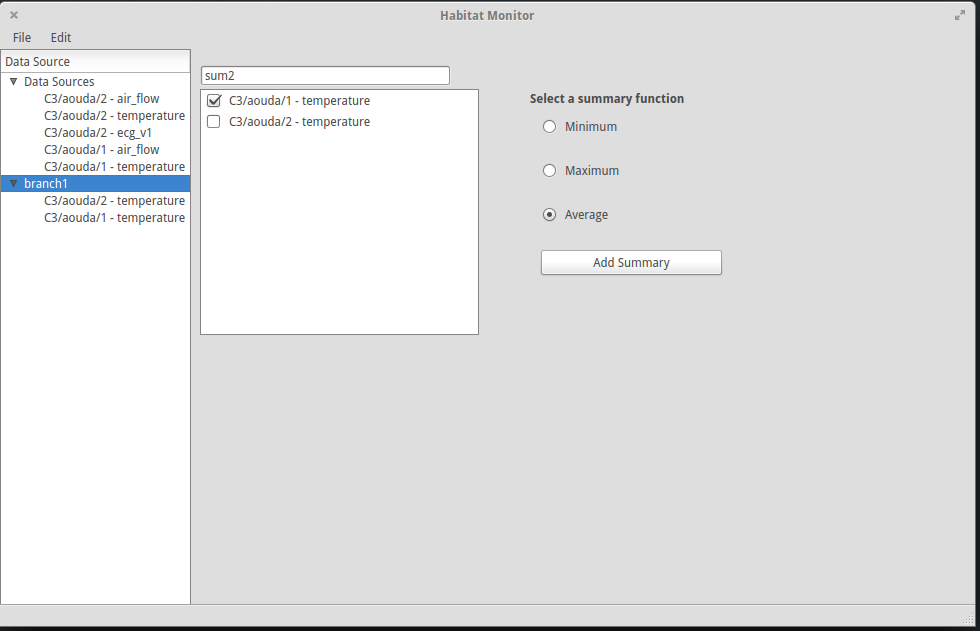
- Click on ‘Add Summary’ button.
1.3.4.3 Summary Deletion
Summary addition works only for branches.
Click on the branch in the left pane.
Navigate to the ‘Summary’ tab.
- Select a summary from the dropdown box.
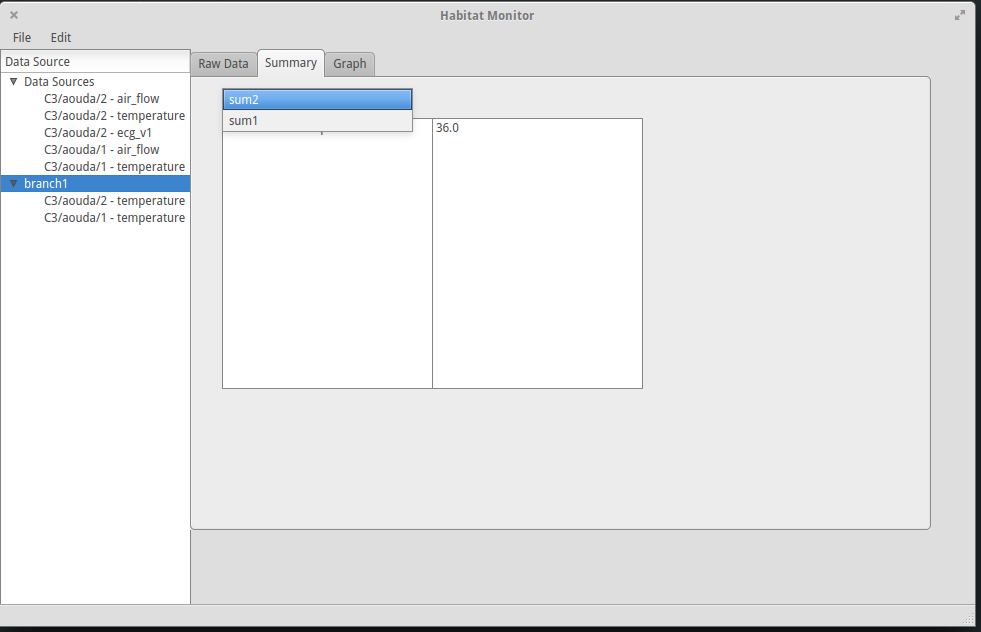
Click on the ‘Edit’ menu.
Click on the ‘Delete Summary’ option.
Click on ‘Yes’ option in the popup to delete the summary.
1.3.5 Node Deletion
If you delete a node from the data source, then it will be deleted from everywhere, i.e., from under all branches. But if you delete it from under a specific branch, it will only be deleted from there.
Click on the node you want to delete.
- Click on the ‘Edit’ menu.
- Select ‘Delete Node’ option.
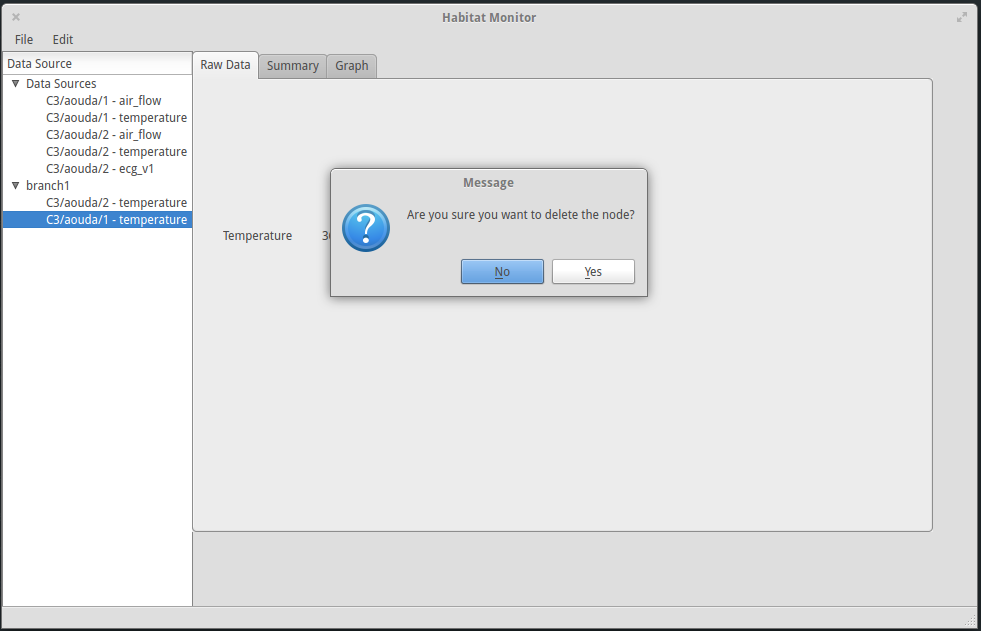
- Click on ‘Yes’ option to delete the node.