1 Health Monitor Software User and Maintenance Manual
| Author: | Mario Tambos |
|---|
1.1 Change Record
2014.05.16 - Document created. 2014.08.20 - Actual manual written. 2015.05.27 - Manual completed
1.2 Introduction
1.2.1 Purpose
This document describes the installation, use and maintenance of the Health Monitor.
1.2.2 Applicable Documents
- [1] – C3 Prototype document v.4
- [3] – Software Engineering Practices Guidelines for the ERAS Project
- [4] – PAMAP2 Physical Activity Monitoring
- [5] – Software Architecture Document for the Health Monitor
- [6] – TANGO distributed control system
- [7] – PyTANGO - Python bindings for TANGO
- [8] – Tango Setup
- [9] – wxPython Installation
- [10] – Adding a new Server in Tango
1.2.3 Glossary
AD- Anomaly Detection
API- Application Programming Interface
AS- Aouda Device Server
ERAS- European Mars Analog Station
GUI- Graphic User Interface
HM- Health Monitor Device Server
HMGUI- Health Monitor Graphical User Interface
IMS- Italian Mars Society
TBC- To Be Confirmed
TBD- To Be Defined
1.3 Overview
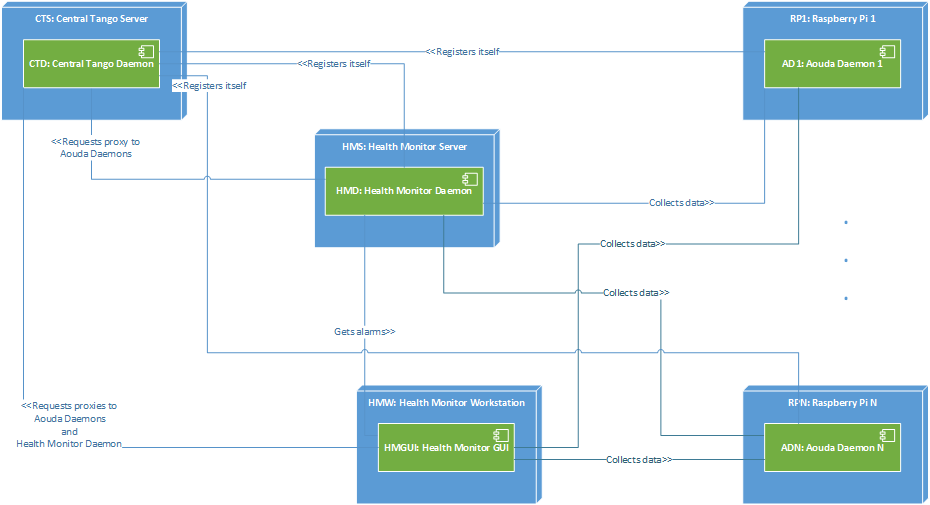
1.3.1 Hardware Architecture
The different hardware components that need to be taken into account are shown in the Deployment Diagram below. As done at the moment all software components can be run in a single computer, they can however also be run each in a different machine.
One key assumption is that one instance of the AS will monitor one single Suit. In other words, one instance of the AS is needed for each crew member during EVA.
1.3.2 Software Architecture
The components involved can be divided in five categories:
- The Central Tango Daemon: It keeps track of the existing Tango Device Servers. For details refer to [7] and [8]. In the context of deployment, the computer that runs the Central Tango Daemon is called “Central Tango Server”.
- The Aouda Device Server (AS): This componen can either run on a Raspberry Pi and read the sensors provided by an e-Health shield, or run on any machine and simulate the sensors. In the context of deployment, the computers that run the AS are called “Raspberri Py i” and the AS themselvs are called “Aouda Daemon i”, where i is an integer.
- The Health Monitor Device Server (HM): Collects data from the AS and performs anomaly detection on their sensor readings. In the context of deployment, the computer that runs the HM is called “Health Monitor Server” and the HM itself is called “Health Monitor Daemon”.
- The Health Monitor Graphic User Interface (HMGUI): allows the user to oversee the crew’s status. It collects data from the AS and the HM. In the context of deployment, the computer that runs the HMGUI is called “Health Monitor Workstation” and the HMGUI itself is called “Health Monitor GUI”.
1.4 Installation Guide
The first step is to download the component to install (Health Monitor Daemon, Aouda Daemon or Health Monitor GUI) in the machine that is going to run it. The components can be installed all in the same computer, all in different computers or any combination thereof.
1.4.1 Installing the Central Tango Daemon on the Central Tango Server
You can install this component following the Tango Setup guide. Tango’s libraries must be installed in all computers.
1.4.2 Installing the Health Monitor Daemon
1.4.2.1 Prerequisites
Python 2.7
- Python modules:
- inflect >= 0.2.4
- numpy >= 1.8.1
- pandas >= 0.14.0
- pip >= 1.5.4
- PyTango >= 8.1.2
- scipy >= 0.14.0
- SQLAlchemy >= 0.9.4
- PyTango >= 8.1.5
libboost-python-dev >= 1.54
1.4.2.1.1 Python 2.7, numpy, pip and scipy
Python 2.7 comes pre-installed, but just in case you can install it, together with numpy, pip and scipy, with:
sudo apt-get install -y libboost-python-dev python2.7 python-pip python-numpy python-scipy
1.4.2.1.2 inflect, pandas, PyTango and SQLAlchemy
inflect, pandas and SQLAlchemy can be installed the normal way:
sudo pip install inflect pandas SQLAlchemy
PyTango, however, needs an additional parameter:
sudo pip install PyTango --egg
1.4.2.2 Registering the Health Monitor Daemon
On a Python or IPython console write:
import PyTango
dev_info = PyTango.DbDevInfo()
dev_info.server = "health_monitor/1"
dev_info._class = "HealthMonitorServer"
dev_info.name = "C3/health_monitor/1"
db = PyTango.Database()
db.add_device(dev_info)
1.4.3 Installing the Aouda Daemon
In order to use the Aouda Daemon to read from the eHealth shield, you need both the shield and a Raspberry Pi running Raspbian. The first step is to get a SD card ready; you can do that by following the official Raspbian installation guide.
Once the SD card is ready, start the Raspberry Pi and log into it.
You can also run the Aouda Daemon in simulation mode from any Ubuntu machine. In this case neither the shield nor the swig package are needed.
1.4.3.1 Prerequisites
Python 2.7
- Python modules:
- MDP >=3.3
- numpy >= 1.8.1
- Oger == 1.1.3
- pandas >= 0.14.0
- pip >= 1.5.4
- PyTango >= 8.1.2
- scipy >= 0.14.0
- setuptools >= 3.3
libboost-python
libboost-python-dev
Swig >= 3.3
1.4.3.1.1 Python 2.7, libboost-python, MDP, numpy, pip, scipy and Swig
Python 2.7 comes pre-installed, but just in case you can install it, together with numpy, pip and scipy, with:
sudo apt-get install -y python2.7 libboost-python-dev python-mdp python-numpy python-pip python-scipy swig
1.4.3.1.2 Pandas and PyTango
Pandas can be installed the normal way:
sudo pip install pandas
PyTango, however, needs an additional parameter:
sudo pip install PyTango --egg
1.4.3.1.3 Oger
This module has to be installed manually. In order to do it, first download the source code: Oger-1.1.3. Then decompress the file and:
cd Oger-1.1.3
sudo python setup.py install
1.4.3.2 Registering the Aouda Daemon
On a Python or IPython console write:
::code
import PyTango dev_info = PyTango.DbDevInfo() dev_info.server = “aouda/1” dev_info._class = “AoudaServer” dev_info.name = “C3/aouda/1” db = PyTango.Database() db.add_device(dev_info)
If you need more than one Aouda Daemon, replace the “1” in the device’s name and server with a different number for each daemon to register.
1.4.4 Installing the Health Monitor GUI
1.4.4.1 Prerequisites
- Python 2.7
- Python modules: + matplotlib>=1.3.1 + numpy>=1.8.1 + pandas>=0.14.0 + PyTango>=8.1.2 + wxmplot>=0.9.14 + wxpython>=3.0
1.4.4.1.1 Python 2.7, matplotlib, numpy and scipy
Python 2.7 comes pre-installed, but just in case you can install it, together with numpy, pip and scipy, with:
sudo apt-get install -y python2.7 python-numpy python-scipy python-matplotlib
1.4.4.1.2 wxPython and wxmplot
You can install wxPython following the wxPython Installation guide.
To install wxmplot just open a Terminal and write:
sudo easy_install -U wxmplot
1.4.4.1.3 Pandas and PyTango
Pandas can be installed the normal way:
sudo pip install pandas
PyTango, however, needs an additional parameter:
sudo pip install PyTango --egg
1.5 User Manual
1.5.1 Configuration
First you need to download the latest version of the software from TBD. The file contains, bar the prerequisites, all needed to run the HM, the AS, including the simulated data, and the HMGUI. Once decompressed you need to (all paths are relative to the archive’s root):
- Configure each HRM instance Now you need to configure each HRM instance’s connection string. To do it open each instance’s configuration file (src/hr_monitor.cfg) and modify the conn_str variable as needed. A sample connection string is provided with the configuration file.
- Configure Aouda Server’s Tango Device Name in each HRM‘s configuration file (src/hr_monitor.cfg); the variable you need to modify is aouda_address.
- Configure the HRM‘s Tango Device Name in the GUI configuration file (src/gui/hr_monitor_gui.cfg); the variable you need to modify is monitor_address.