1 Heart Rate Monitor Software User and Maintenance Manual
| Author: | Mario Tambos |
|---|
1.1 Change Record
2013.09.11 - Document created.
2013.09.17 - Update format with user manual template and corresponding content.
1.2 Introduction
1.2.1 Purpose
This document describes the installation, use and maintenance of the Heart Rate Monitor.
1.2.2 Applicable Documents
- [1] – C3 Prototype document v.4
- [2] – PAMAP2 Physical Activity Monitoring
- [3] – Software Engineering Practices Guidelines for the ERAS Project
- [4] – ERAS 2013 GSoC Strategic Plan
- [5] – Software Requirements Specification for the Heart Rate Monitor
- [6] – Software Design Study for the Heart Rate Monitor
- [7] – TANGO distributed control system
- [8] – PyTANGO - Python bindings for TANGO
- [9] – Tango Setup
- [10] – wxPython Installation
- [11] – Adding a new Server in Tango
- [12] – Wei, Li, et al. “Assumption-Free Anomaly Detection in Time Series.” SSDBM. Vol. 5. 2005. APA
1.2.3 Glossary
AD- Anomaly Detection
API- Application Programming Interface
ERAS- European Mars Analog Station
GUI- Graphic User Interface
HRM- Heart Rate Monitor
IMS- Italian Mars Society
TBC- To Be Confirmed
TBD- To Be Defined
1.3 Overview
1.3.1 Hardware Architecture
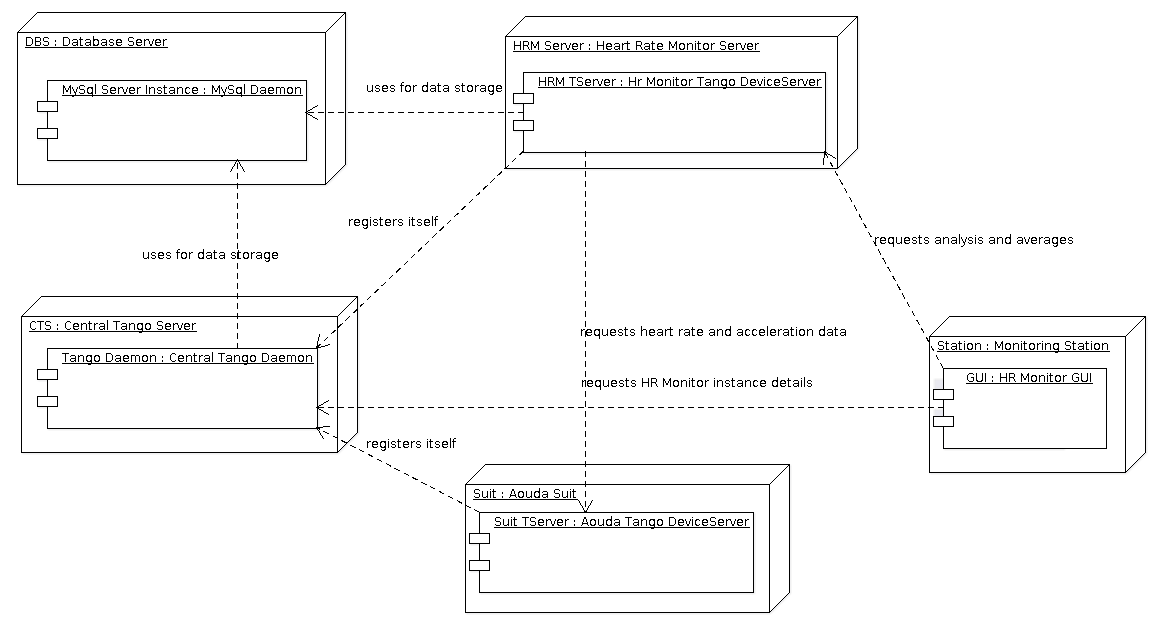
The different hardware components that need to be taken into account are shown in the Deployment Diagram below. As done at the moment all software components can be run in a single computer, they can however also be run each in a different machine. One key assumption is that one instance of the HRM will monitor one single Suit. In other words, one instance of the HRM is needed for each crew member during EVA. This instances can be hosted in the same computer or in different ones, they can also use different MySql instances or the same one. The only caveat is that in the later case (shared MySql server instance), different databases MUST be used.
1.3.2 Software Architecture
- The components involved can be divided in five categories:
- The central Tango Daemon: It keeps track of the existing Tango Device Servers. For details refer to [7] and [8].
- The MySql Server instance (or instances): At least one is used by the Tango Daemon. The HRM also needs an instance, that can be the same one used by the Tango Daemon. Each instance of the HRM needs a different database to store its data, that means having one database on one MySql Server instance for each HRM instance, or using the same MySql Server instance for all HRM instances, but creating and configuring different databases. For details see the Installation Guide
- The Aouda Suit Device Server: Currently this component only simmulates the Suit taking data from one of the datasets in [2]. Provides data to the HRM.
- The Heart Rate Monitor Device Server: The core of the project.
- The Heart Rate Monitor Graphic User Interface: Just a proof of concept at the moment. It allow the user to see some statistics provided by the HRM. As it is, the GUI can only connect to a single HRM instance at a time, so one needs to start as many GUIs as HRM instances one wants to oversee.
1.4 Installation Guide
1.4.1 Prerequisites
Python 2.7
Tango Controls v7.2.2
MySql Server
- Python modules:
- numpy
- scipy
- pandas
- matplotlib
- PyTango v7.2.2
- sqlalchemy
- wxpython
- wxmplot
1.4.1.1 Installing Prerequisites in Ubuntu System
1.4.1.1.1 Python 2.7
Python 2.7 comes pre-installed, but just in case you can install it with:
sudo apt-get install python2.7
1.4.1.1.2 Tango Controls v7.2.2, PyTango and MySql
You can install these three components following the Tango Setup guide.
Besides that, the HR Monitor just needs the MySql-Python connector:
sudo apt-get install python-mysqldb
The first line will open the MySql console, the second will create the database and the third will show you the existing database, to confirm everythong is OK.
1.4.1.1.3 Numpy, Scipy, Pandas and Matplotlib
Since these three modules rely on C libraries, it’s recommended to install them using apt-get instead of easy_install/pip. They should have been installed during the PyTango installation, but if not:
sudo apt-get install python-numpy python-scipy python-matplotlib
sudo pip install pandas
1.4.1.1.4 SqlAlchemy
You can install it from PyPi with:
sudo apt-get install python-pip
sudo pip install SQLAlchemy
1.4.1.1.5 wxPython and wxmplot
You can install wxPython following the wxPython Installation guide.
To install wxmplot just open a Terminal and write:
sudo easy_install -U wxmplot
1.4.2 Heart Rate Monitor Installation
First you need to download the latest version of the software from TBD. The file contains, bar the prerequisites, all needed to run the HRM, the Aouda Server, including the simmulated data, and the HRM GUI. Once decompressed you need to (all paths are relative to the archive’s root):
Create a database for each HRM you want to run: You can do this by opening a shell in the computer you have your MySql Server instance running and typing the following for each instance, which will create a database and show the list of databases for confirmation.
mysql -u [user] -p[password]
> create database [HRM instance name];
> show databases;
Configure each HRM instance Now you need to configure each HRM instance’s connection string. To do it open each instance’s configuration file (src/hr_monitor.cfg) and modify the conn_str variable as needed. A sample connection string is provided with the configuration file.
Register both the Aouda and HR Monitor Tango Servers: To do it, just follow Adding a new Server in Tango. In both cases the class name is ‘PyDsExp’, without quotation marks.
Configure Aouda Server’s Tango Device Name in each HRM‘s configuration file (src/hr_monitor.cfg); the variable you need to modify is aouda_address.
Configure the HRM‘s Tango Device Name in the GUI configuration file (src/gui/hr_monitor_gui.cfg); the variable you need to modify is monitor_address.
Once all this is done, all is in place to start running the programs.
1.5 User Manual
1.5.1 Application Start-up
In the following we will assume a single instance of the HRM, Aouda Device Server and HRM GUI. For more instances just repeat the steps for each instance.
First of all, you’ll have to run the Aouda Tango Server. This server will simmulate the Aouda Suit, making data available for the HRM instance to consume. To do this, just open a Terminal and type:
cd /path/to/hr_monitor/src
python aouda [instance name]
Once done, you can start the HRM itself with:
python hr_monitor [instance name]
The simmulation has approximately 45 minutes of data. After that time it willll start repeating the data from the beginning.
Now if you want to see the alarm levels, you can do it by starting the HRM GUI. To do it type the following in a Terminal:
export TANGO_HOST=[IP:Port of the Tango central server]
cd /path/to/hr_monitor/src/gui
python app.py
To start collecting data from the HRM instance, press the “Collect data” button.
1.5.2 Application Shut-down
The HRM GUI can be shut down with its window’s close button (x). Both HRM and Aouda Device Server must be shut down with the key combination Ctrl+C. There’s a pending bug that causes the HRM to need two presses of Ctrl+C.
1.5.3 GUIs
The HRM GUI is shown in the following image:
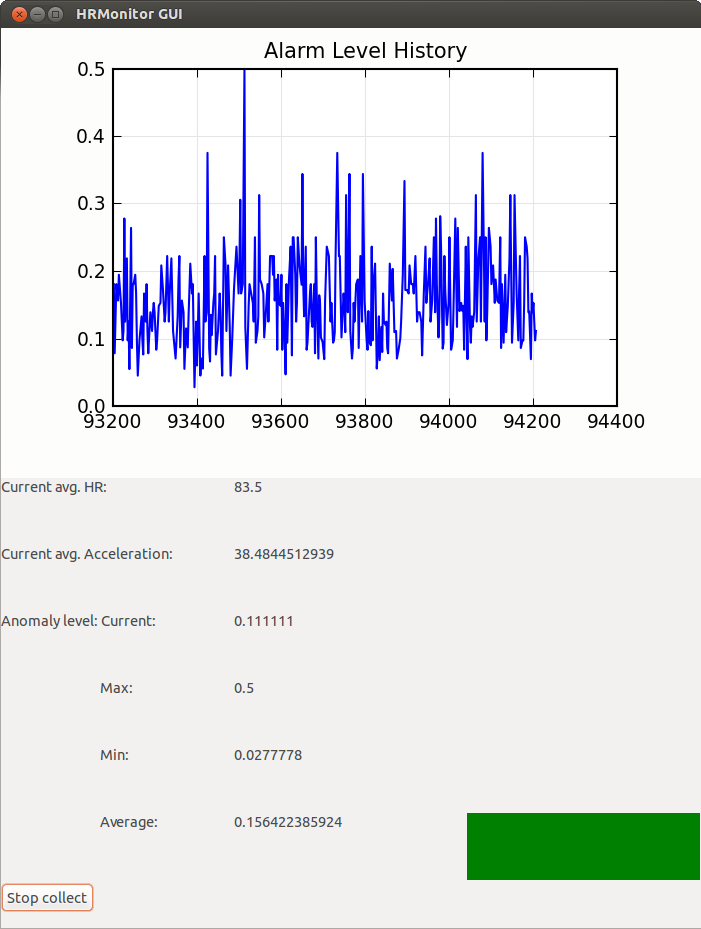
The top panel provides a history of the alarm level values. The left panel shows different statistics over those values as also over the heart rate and acceleration values. The right panel shows during operation a color-coded severity of the latest alarms; green for low, yelow for medium and red for high severity. You can adjust the thresholds for the colors from the configuration file (src/gui/hr_monitor_gui.cfg), the variables you need to modify are yellow_alrm_thrsh and red_alrm_thrsh. From the same configuration file you can also configure how often the HRM GUI must poll its associated HRM instance, by modifying the sleep_time variable, in seconds.
1.6 Maintenance Manual
For maintenance purposes it is higly recomended to first read [5] and [6].
1.6.1 Internals
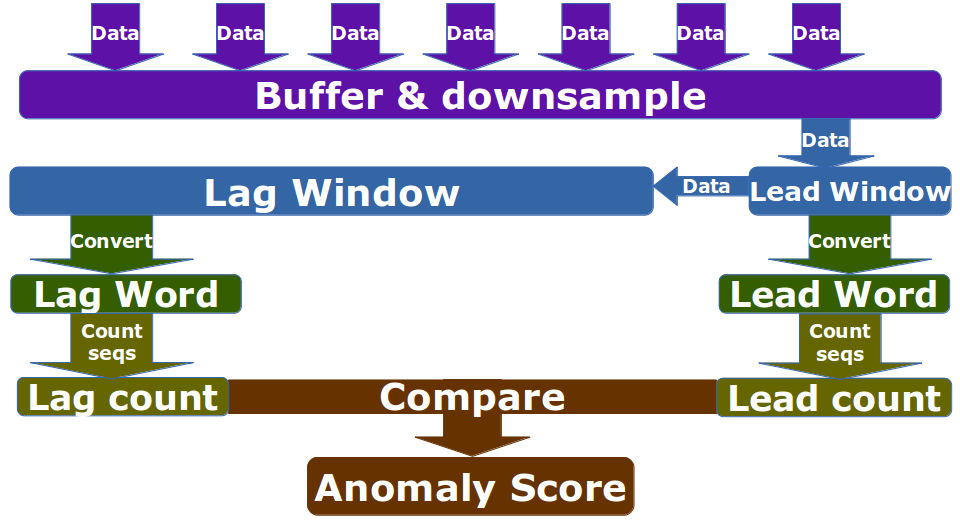
- In short the anomaly detection progresses in the following steps:
- We combine heart rate and acceleration into a single feature: HA = [heart rate]/[acceleration’s magnitude] Therefore our anomalies will be marked with a HA value very close to 0 or very big, when the heart is beating too slow/quickly.
- We downsample to [resolution] seconds. So datapoints occurring at a higher frequency become a single one (their mean). It bears mentioning that by doing this we are not losing a lot of information.
- Then we follow [12]:
- Divide data into a lead window (current situation) of size [word_size] * [window_factor] * [lead_window_factor], which collects the new datapoints, and a lag window (historical trend) of size [word_size] * [window_factor] * [lag_window_factor], which collects the data overflowed from the lead window.
- Convert each window into a single [word_size] * [window_factor] length word, using a four char alphabet (using SAX algorithm).
- Count the 2 char combination’s frequencies.
- Use as anomaly score the differences in the counts between the lead and lag window’s words.
A schematic diagram of the preceding steps is shown in the following figure:
The [variables] are explained in some better detail in the Additional Configuration section.
1.6.2 Application Program Interface (API)
The HRM GUI does not have any programmable interface. The Aouda Device Server publishes one Tango Command and two Tango Attributes:
DevVarDoubleStringA get_data(DevLong period): Returns an array with all datapoints from last query untilthe current date and time. The format is:
[
   [hr1, acc_x1, acc_y1, acc_z1,
    hr2, acc_x2, acc_y2, acc_z2,
    ...
    hrN, acc_xN, acc_yN, acc_zN],
   [timestamp1, timestamp1, timestamp1, timestamp1,
    timestamp2, timestamp2, timestamp2, timestamp2,
    ...
    timestampN, timestampN, timestampN, timestampN],
]
DevFloat heart_rate - scalar, read-only: Returns the instantaneous heart rate. The underlying device’s sampling frequency is 9Hz.
DevFloat acc_magn (scalar, read-only): Returns the instantaneous acceleration vector’s magnitude. The underlying device is an accelerometer placed on the torso, with a +-16g range, 13 bit precission and 100Hz sampling frequency.
The HRM publishes four Tango Commands:
- DevVoid register_datapoint(DevVarDoubleArray datapoint): Registers a new datapoint in the database and launches a new thread to analyze the data collected so far. datapoint must have the format [timestamp, hr, acc_x, acc_y, acc_z].
- DevFloat get_avg_hr(DevLong period): Returns average heart rate over the given [period] (in seconds).
- DevFloat get_avg_acc(DevLong period) Returns average acceleration over the given [period] (in seconds).
- DevVarDoubleStringArray get_current_alarms(DevLong period): Returns the alarm scores generated in the last [period] seconds. The return value format is [[alarm_lvl1, ..., alarm_lvlN], [timestamp1, ..., timestampN]]
Additionally, uppon start up the HRM launches a thread that polls the Aouda Server periodically, and then calls the register_datapoint method to store the data returned. You can adjust the polling period by changing the polling_frequency variable from the configuration file (src/hr_monitor.cfg), in seconds.
1.6.3 Additional Configuration
The HRM‘s configuration file (src/hr_monitor.cfg) exposes, aside the values explained above, the following variables:
- [Detector]:
- word_size: It affects the length of features used to detect anomalies.
- window_factor: Also affects the length of the features, each feature comprises window_factor * word_size datapoints.
- lead_window_factor Affects the length of the lead window, which consists of window_factor * word_size datapoints * lead_window_factor datapoints.
- lag_window_factor Affects the length of the lag window, which consists of window_factor * word_size datapoints * lag_window_factor datapoints.
- [Monitor]:
- resolution: In milliseconds, it affects the data’s sample frequency to be considered. If finer grained data is available it is down sampled to [resolution] ms frequency.
To better understand what the different variables mean, please refer to the Internals section. All of the above are set with values that should provide good analysis results. However, as this is a highly experimental field, you should feel free to experiment with them in order to make the most of this tool.
1.7 Troubleshooting
Since this is the first version of the product, it is difficult to foresee what problems could be encountered during the execution of the project’s components. The previous guides have been written trying to forestall any difficulties during the initial set up and running. If you happen to encounter problems, first please double check that all prerequisites are met, and that you follow to the letter all instructions; in the ideal case starting with a fresh installation. Were the problem not resolved, or were you left with unaswered questions, please don’t hessitate to contact us.